New mapping technology makes it safer to sail in Arctic waters
The ice in the Arctic is melting, making the area increasingly appealing for business activity. But sea ice can do great harm on vessels. When researchers at UiT went on a cruise this summer, they found that a new algorithm could provide better maps for a safer journey. Read about the cruise and what the researchers found out.
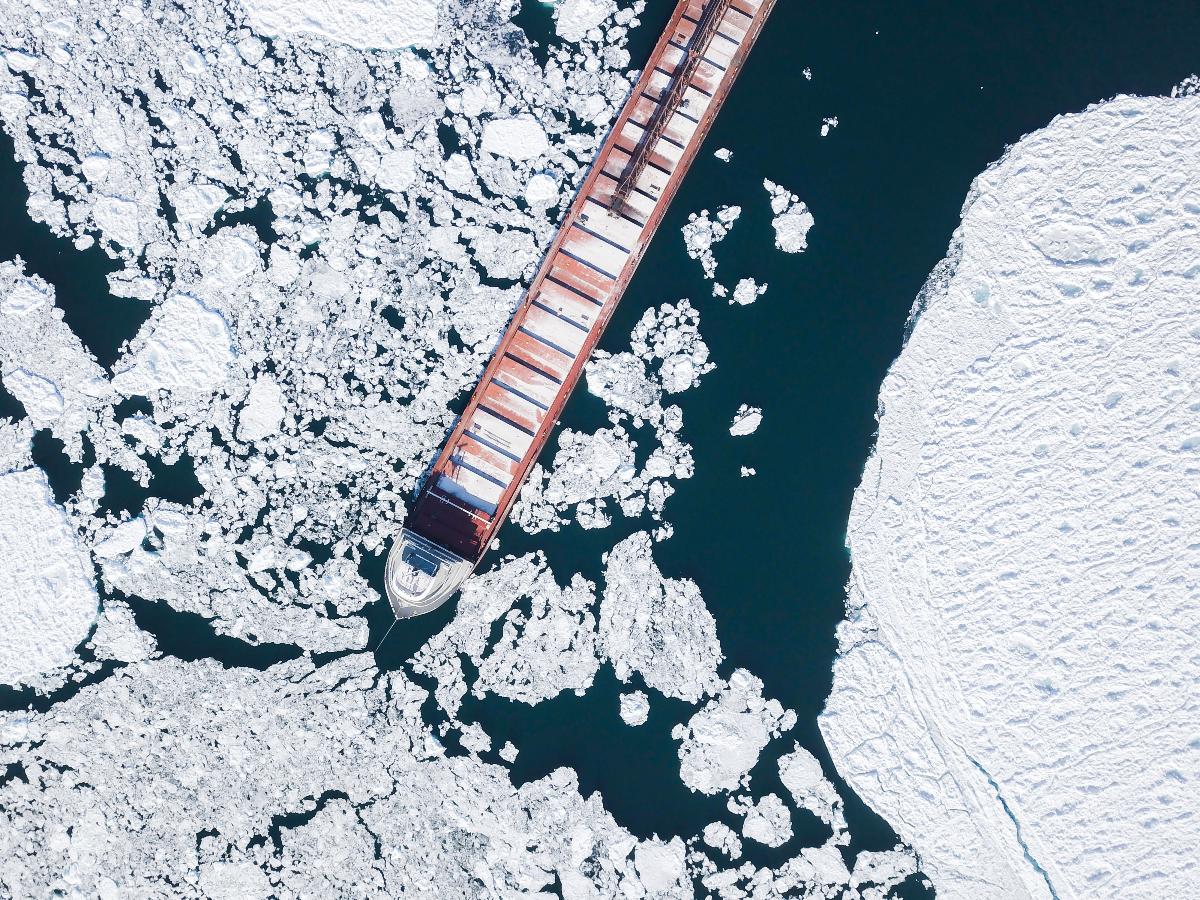
We are on the bridge of KV Svalbard, somewhere north of Svalbard, conducting a scientific cruise led by the Nansen Environmental and Remote Sensing Center (NERSC). Participating in the voyage are researchers and students from the CIRFA research center who are working to develop surveillance technologies in the Arctic. The cruise is part of Useful Arctic Knowledge (UAK), Integrated Arctic Observation System (INTAROS) and Digital Arctic Shipping projects, and have participation of 12 PhD and master´s students from seven countries.
It is mid-June, and yesterday’s clear and sunny weather has changed into thick foggy greyness. Visibility is low, the sea is flat and, looking at where the horizon used to be, one can barely tell where the ocean ends and the sky begins.

The perks of sea ice
Sea ice is a fascinating and dynamic part of the polar environment and the Earth’s climate system.
The sea ice in the Arctic changes with the seasons; new ice forms during cold periods, grows thicker over the winter months, is squeezed into thick ice flows and ridges, or breaks apart and melts in the Arctic summer.
Small and large icebergs frequently break off from glaciers around Greenland and Svalbard and float through the icy Arctic waters. Wind, ocean currents and waves constantly move the icebergs and the sea ice, which adds to the dangers of travelling through it.

Challenges for polar travel

Sea ice and icebergs also proved problematic for passenger travel. The maiden voyage of the Titanic in 1912 is anchored to the public historic memory as a tragedy caused by a collision with a drifting iceberg that most likely originated from a glacier in western Greenland.
If ice maps would have been available in the 19th and 20th century, things may have ended differently.

Increased human activity in icy waters
Less and thinner sea ice makes Arctic waters increasingly appealing for human activity such as shipping, fishing, tourism and mineral exploration. Ocean areas that were previously covered by thick and dense sea ice now have a thinner ice cover and are subsequently becoming more and more accessible.
Some of these places are still uncharted, with the seabed conditions unknown, and others are open water or covered by loose sea ice. However, sea ice can drift fast and can damage vessels and offshore structures.

The need to increase safety
Far from civilization with few icebreakers around to help, without being at risk of being enclosed by thick sea ice or unexpectedly meeting an iceberg - how can vessels safely navigate? What types of sea ice are out there in the Arctic Ocean? Where are they located, where are they drifting to, and how fast are they moving? How can we map them to help ships decide the best and safest course? How we do this efficiently for large and remote areas? There are many questions to address!
The traditional way of mapping sea ice relies on visual analysis and interpretation of radar satellite images by sea ice analysts. The results of this analysis are then provided to the ship captains in the form of sea ice type or sea ice concentration maps. However, manual production of these maps is a time consuming and arduous task.
Researchers at UiT and the partners in CIRFA are developing new ways to identify and map sea ice. We use data from a synthetic aperture radar instrument, carried by satellites such as the European SENTINEL-1 and Canadian RADARSAT-2 satellites. The satellites cross over the Arctic several times a day and scan the ocean surface in beams that can be up to a few hundred kilometres wide. In contrast to optical sensors, the radar can see the ocean surface through clouds and in darkness.
New ways to make sea ice maps
Instead of visually interpreting each satellite image, researchers at CIRFA and MET have developed an algorithm that automatically interprets many satellite images at a time. The algorithm built by CIRFA researchers Johannes Lohse, Wenkai Guo and Anthony Doulgeris can recognize different types of sea ice. Its ability to do this is rooted in the physical properties of the backscatter; the strength of the radar signal that is reflected from the Earth surface and recorded by the satellite.
To understand how backscatter works, imagine how the light of a flashlight reflects differently depending on what you shine the light on. Like smooth surfaces appearing bright and corners or edges making shadows, the reflected radar signal depends on whether the water or ice is rough and deformed, or if it’s smooth, almost like a mirror. The change in backscatter, if properly analysed, tells us about different sea ice types and open water areas.
The algorithm can make a map based on satellite imagery for a specific location, for example in the northern Atlantic Ocean, in as little as 15 minutes. For larger areas, or areas that are not as frequently overflown by satellites, it will take more time to acquire data and make maps.
Testing the algorithm in real conditions
PhD candidates Anna Telegina, Jozef Rusin and Laust Færch, and the Norwegian Meteorological Institute (MET) engineer Alistair Everett joined the UAK research cruise on KV Svalbard in June 2021 when CIRFA's automatic sea ice classification was tested. The team on the ship compared the automatically derived sea ice maps with reality around the vessel to control and confirm the information from the algorithm.


The researchers were pleased about the positive results: the algorithm interprets the satellite data well and detects different ice types that the researchers on-board confirmed. Based on the simultaneous feedback, the algorithm could even be improved during the ongoing cruise.
However, a lot more research and fieldwork are needed until automatically made ice maps may become a reliable source of information. Looking further ahead, automatically generated sea ice information on a regional and pan-Arctic scale will ease decision-making in navigation, search-and-rescue and other maritime activities in remote, ice-covered waters.

Partners: Centre for Integrated Remote Sensing and Forecasting for Arctic Operations (CIRFA), the Norwegian Coast Guard, The Nansen Environment and Remote Sensing Center (NERSC), the Norwegian Meteorological Institute (MET Norway, Integrated Arctic Observation System (INTAROS), the project Digital Arctic Shipping and the Norwegian Research Center (NORCE).
Contributors to this text: Andrea Schneider, Thomas Kræmer, Johannes Lohse, CIRFA. From the Norwegian Ice Service that is run by MET Norway: Alistair Everett and Nick Hughes. Tom Rune Lauknes, NORCE. Elisabet Aaraas, Section for communication, UiT.

-
Fiskeri- og havbruksvitenskap - bachelor
Varighet: 3 År -
Fiskeri- og havbruksvitenskap - master
Varighet: 2 År -
Akvamedisin - master
Varighet: 5 År -
Bioteknologi - bachelor
Varighet: 3 År -
Arkeologi - master
Varighet: 2 År -
Peace and Conflict Transformation - master
Varighet: 2 År -
Geosciences - master
Varighet: 2 År -
Biology - master
Varighet: 2 År -
Technology and Safety in the High North - master
Varighet: 2 År -
Physics - master
Varighet: 2 År -
Molecular Sciences - master
Varighet: 2 År -
Law of the Sea - master
Varighet: 3 Semestre -
Biologi - bachelor
Varighet: 3 År -
Arkeologi - bachelor
Varighet: 3 År -
Religionsvitenskap - bachelor
Varighet: 3 År -
Likestilling og kjønn - årsstudium
Varighet: 1 År -
Historie - bachelor
Varighet: 3 År -
Religionsvitenskap - master
Varighet: 2 År -
Geologi - bachelor
Varighet: 3 År -
Kjemi - bachelor
Varighet: 3 År -
Samfunnssikkerhet og miljø - bachelor
Varighet: 3 År -
Russlandsstudier - bachelor
Varighet: 3 År -
Samfunnssikkerhet - master
Varighet: 2 År -
Kunst - bachelor
Varighet: 3 År -
Kunsthistorie - master
Varighet: 2 År -
Religionsvitenskap - årsstudium
Varighet: 1 År -
Romfysikk, sivilingeniør - master
Varighet: 5 År -
Klima og miljøovervåkning, sivilingeniør - master
Varighet: 5 År -
Sosialantropologi - bachelor
Varighet: 3 År -
Bærekraftig teknologi, ingeniør - bachelor
Varighet: 3 År -
Historie - master
Varighet: 2 År -
Russlandsstudier - master
Varighet: 2 År -
Anvendt fysikk og matematikk, sivilingeniør - master
Varighet: 5 År -
Barnevernsarbeid - master
Varighet: 2 År -
Forfatterstudium 2 - årsstudium
Varighet: 1 År -
Fine Art - master
Varighet: 2 År -
Barnevern - bachelor
Varighet: 3 År -
Arctic Nature Guide - one year programme
Varighet: 1 År -
Northern Studies - bachelor
Varighet: 3 År -
Tourism Studies - master
Varighet: 2 År -
Sosialt arbeid - bachelor
Varighet: 3 År -
Arktisk friluftsliv og naturguiding - bachelor
Varighet: 3 År -
Arktisk friluftsliv - årsstudium
Varighet: 1 År -
Forfatterstudium 1 - årsstudium
Varighet: 1 År -
Arctic Adventure Tourism - bachelor
Varighet: 3 År -
Grunnskolelærerutdanning for 1.-7. trinn - master
Varighet: 5 År -
Kunsthistorie - årsstudium
Varighet: 1 År -
Governance and Entrepreneurship in Northern and Indigenous Areas - master
Varighet: 4 År -
Samfunnsplanlegging - nettbasert førstesemesterstudium
Varighet: 1 Semestre -
Internasjonal beredskap (samlingsbasert) - bachelor
Varighet: 3 År