Arctic sea-ice monitoring: from the Vikings to satellite observations
The first Arctic sea-ice observations were documented by the Vikings, and later followed by the first polar explorers and sailors. Today, the IceBird program is part of an international monitoring series, documenting the Arctic ice cover as it undergoes rapid changes due to climate warming.
The Arctic Ocean spans roughly 14 million square kilometers - about half the area of Africa – and is, at least partly, covered by sea-ice year-round. This ice cover plays a fundamental role in the Earth’s climate system. It influences the global ocean circulation, prevents energy absorption from the Sun due to its high albedo, and limits heat exchange between the ocean and overlying atmosphere.
Changes in the sea-ice cover can therefore have implications reaching far beyond the Arctic region. Observing these changes requires systematic monitoring of the Arctic Ocean, which is difficult due to its vastness, remoteness, and harsh environment.
The long history of sea-ice observations

The oldest record of sea-ice observations dates back to as early as 870 A.D. and was assembled by the Vikings. The record contains the number of weeks per year that sea-ice was seen along the north coast of Iceland. It was not until the 15th - 16th century that other sea-ice records showed up, this time collected by the first polar explorers and sailors such as John Cabot and Willem Barentsz, in their quest for the Arctic shipping routes.
The notes from the polar explorers, and later whalers and trappers, provide insightful information on the sea-ice conditions but are scarce both in time and space. The first actual sea-ice thickness measurements were taken during the Jeannette Expedition from 1879 to 1881 using an auger. As aviation picked up in the early 20th century, it allowed for observations across larger spatial scales, such as during the first North Pole overflight by Roald Amundsen in 1926.
The second half of the 20th century brought along new technologies that enabled us to monitor Arctic sea ice in a systematic manner for the first time. Submarines equipped with upward-looking sonars provided estimates of sea-ice draft along their tracks.

Since the late 70’s, microwave radiometer onboard satellites have provided continuous sea-ice observations across the Arctic, leading to the first maps showing sea-ice area and extent, as well as routinely produced ice charts for navigation purposes.
Nowadays, satellites carry a variety of sensors acquiring sea-ice observations, such as altimeters providing estimates of freeboard height that are subsequently converted to sea- ice thickness estimates, or synthetic aperture radar (SAR) sensors providing imagery of the sea-ice cover which can be used to estimate ice drift.
We still need to be on the ice
Even though the spaceborne observations give us the spatiotemporal coverage that is needed to monitor the Arctic Ocean and its sea ice, we still rely on in-situ (“on the ice”) or airborne measurements to validate the information retrieved from satellite data. Dedicated field campaigns collect sea-ice observations that are used as comparison material.
Nevertheless, the large discrepancies in spatial and temporal scales make it hard to directly compare the different observations to each other: from the instant point measurements such as drill-holes or snow pits, to the airborne measurements with drones or planes that cover tens to hundreds of kilometers in the range of days, to the satellite observations spanning the entire Arctic year-round.

The German Alfred Wegener Institute, Helmholtz-Center for Polar- and Marine Research (AWI) has been running sea-ice surface roughness surveys since 1993 and sea-ice thickness surveys since 2003. The IceBird program is part of this monitoring series in the form of airborne sea-ice thickness surveys run twice a year, in summer and winter.
These campaigns have documented, in detail, the Arctic ice cover as it has changed rapidly with climate warming over the past few decades. More recently, the airborne measurements offer a unique reference for validating satellite observations of the sea ice. During the survey flights, sea-ice thickness is inferred from a combination of electromagnetic (EM) induction measurements and laser measurements.
The induction measurements are obtained with the ‘EM-Bird’, a torpedo-like sensor towed under the airplane at an altitude of 15 meters above the sea ice. This provides the distance between the EM-Bird and the interface between the ice and underlying sea water. The corresponding laser measurements provide the distance from the EM-Bird to the top of the snow or ice surface. The difference between the ice-water interface distance and snow or ice surface distance is the total sea-ice thickness, as shown in the illustration.
In winter this is rather the combined snow and ice thickness, whereas in summer this is just the ice thickness as snow has largely melted.
The Summer 2024 Campaign
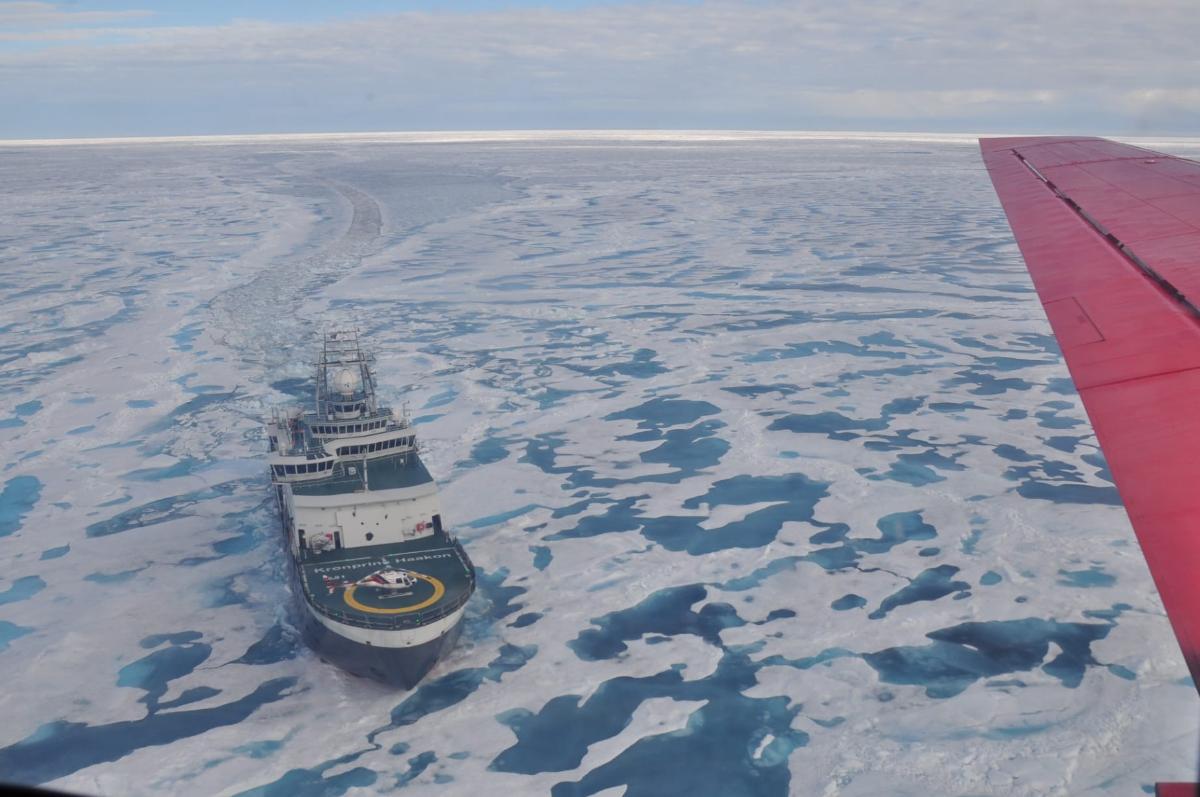
The Summer 2024 campaign is operating from Station Nord in Greenland and carrying out survey flights over the Lincoln Sea and Fram Strait. Apart from the usual monitoring transects, this year’s campaign collected sea-ice thickness data over an in-situ sea-ice station of the Norwegian icebreaker R/V Kronprins Haakon at 86°N.

– This will allow us to place the in-situ measurements taken by scientists onboard the ship into a wider context. If the weather allows, we aim to survey a ‘satellite underflight’, which is a flight over the ground track of an overpassing satellite altimeter, says Catherine Taelman from UiT the Arctic University of Norway and participating scientist in this year’s campaign.
– As we are surveying drifting sea ice, it is important to minimize the time gap between the satellite overpass and the flight in order to acquire data over the exact same ice. Such a data set provides the opportunity to, for example, further investigate biases in sea-ice thickness retrievals from space. The AWI IceBird campaigns build upon a long legacy of sea-ice surveying in the Arctic, thereby providing essential data for climate studies, Taelman adds.
With just a few surveying days left, the IceBird team can already look back on a good campaign.
– We all enjoyed the beautiful views of the Arctic Ocean covered with sea ice, melt ponds, icebergs, and the occasional seal. We will be returning home with lots of new impressions, motivation, and unique data to continue our research, Taelman says.


-
Fiskeri- og havbruksvitenskap - bachelor
Varighet: 3 År -
Fiskeri- og havbruksvitenskap - master
Varighet: 2 År -
Akvamedisin - master
Varighet: 5 År -
Bioteknologi - bachelor
Varighet: 3 År -
Arkeologi - master
Varighet: 2 År -
Peace and Conflict Transformation - master
Varighet: 2 År -
Geosciences - master
Varighet: 2 År -
Biology - master
Varighet: 2 År -
Technology and Safety - master
Varighet: 2 År -
Physics - master
Varighet: 2 År -
Mathematical Sciences - master
Varighet: 2 År -
Biomedicine - master
Varighet: 2 År -
Computational chemistry - master
Varighet: 2 År -
Law of the Sea - master
Varighet: 3 Semestre -
Biologi - bachelor
Varighet: 3 År -
Medisin profesjonsstudium
Varighet: 6 År -
Nordisk - årsstudium
Varighet: 1 År -
Luftfartsfag - bachelor
Varighet: 3 År -
Pedagogikk - bachelor
Varighet: 3 År -
Arkeologi - bachelor
Varighet: 3 År -
Informatikk, datamaskinsystemer - bachelor
Varighet: 3 År -
Informatikk, sivilingeniør - master
Varighet: 5 År -
Likestilling og kjønn - årsstudium
Varighet: 1 År -
Historie - bachelor
Varighet: 3 År -
Geovitenskap- bachelor
Varighet: 3 År -
Biomedisin - bachelor
Varighet: 3 År -
Samfunnssikkerhet - bachelor
Varighet: 3 År -
Matematikk - årsstudium
Varighet: 1 År -
Ergoterapi - bachelor
Varighet: 3 År -
Fysioterapi - bachelor
Varighet: 3 År -
Radiografi - bachelor
Varighet: 3 År -
Samfunnssikkerhet - master
Varighet: 2 År -
Kunst - bachelor
Varighet: 3 År -
Kunsthistorie - master
Varighet: 2 År -
Farmasi - bachelor
Varighet: 3 År -
Farmasi - master
Varighet: 2 År -
Religionsvitenskap - årsstudium
Varighet: 1 År -
Romfysikk, sivilingeniør - master
Varighet: 5 År -
Sosialantropologi - bachelor
Varighet: 3 År -
Bærekraftig teknologi, ingeniør - bachelor
Varighet: 3 År -
Historie - master
Varighet: 2 År -
Odontologi - master
Varighet: 5 År -
Anvendt fysikk og matematikk, sivilingeniør - master
Varighet: 5 År -
Barnevernsarbeid - master
Varighet: 2 År -
Forfatterstudium 2 - årsstudium
Varighet: 1 År -
Fine Art - master
Varighet: 2 År -
Barnevern - bachelor
Varighet: 3 År -
Arctic Nature Guide - one year programme
Varighet: 1 År -
Sosialt arbeid - bachelor
Varighet: 3 År -
Arktisk friluftsliv og naturguiding - bachelor
Varighet: 3 År